Monitoring & Incident Response
Canary monitoring, automated escalation, and AI triage for the systems and servers your business runs on -- with a coverage tier sized to what an outage actually costs you.
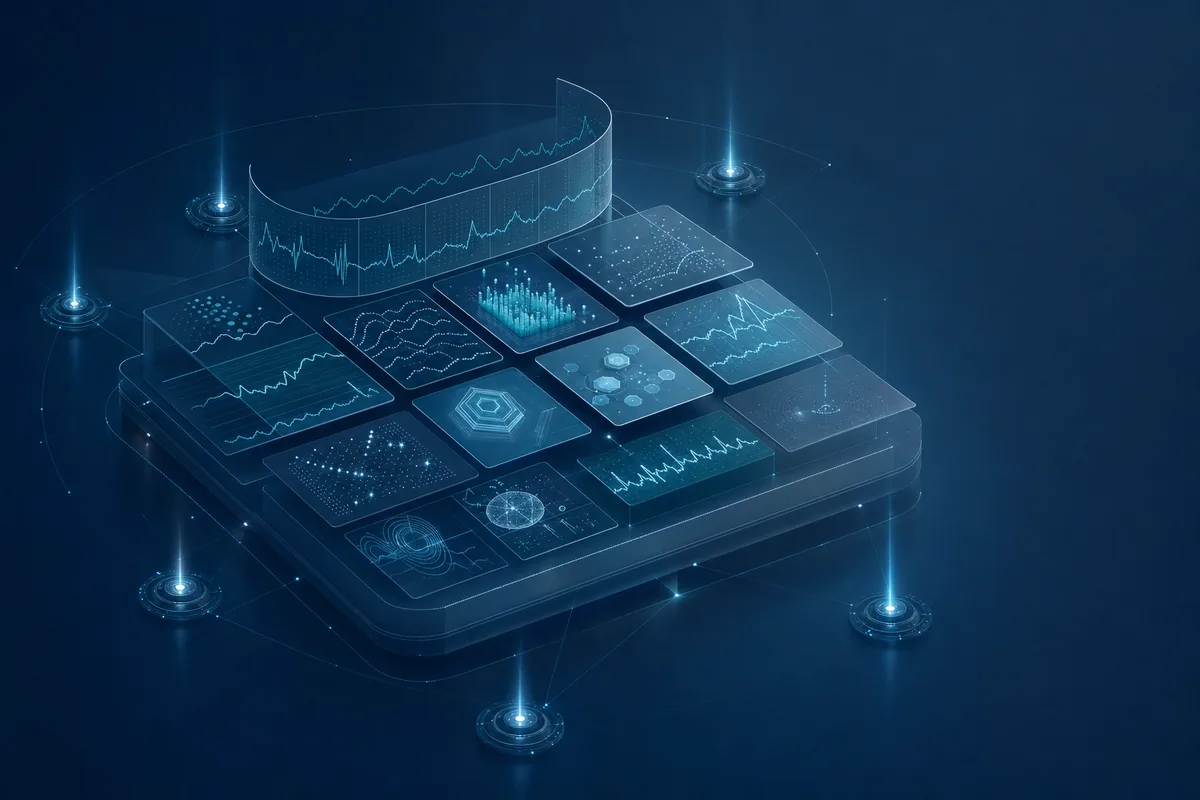
Coverage Sized to Your Risk, Not Sold by the Hour
Our observability stack is opinionated: Datadog for metrics/logs/APM, Grafana when you already run Prometheus, and PagerDuty for incident routing. Applications are instrumented with OpenTelemetry so traces flow through whichever backend you prefer. SLOs are defined per customer-facing service (not per server) -- typically four golden signals (latency, traffic, errors, saturation) with error-budget burn-rate alerts that page on multi-window violations rather than single threshold breaches.
Coverage is business hours plus an on-call rotation, and the response target is agreed with you rather than advertised here. A tighter target costs more to staff, and the right one depends on what an hour of degradation actually costs your business -- so we size it with you instead of publishing a number designed to win a comparison. Whatever we agree goes in the SOW and gets reported against monthly. On-call is a real rotation, not a Slack channel: runbooks live in your repo, severity routing is documented, and quarterly game-day exercises check the playbooks still work. This practice covers systems and servers; it is not desktop or end-user support.
Monitoring scope spans application, infrastructure, and business KPIs. AWS CloudWatch and GuardDuty for account-level signal, Datadog APM for application-level visibility, Synthetics for outside-in checks against critical user journeys, and Real User Monitoring when frontend latency matters. ML-driven anomaly detection sits on top of the baseline metrics so cost spikes and traffic abnormalities surface before customers notice.
Why Choose Our Monitoring & Incident Response
Engineering rigor, audit-ready process, and operational depth across cloud, SaaS, and software delivery
Tier 1 — Canary & Escalation
Canary checks against the paths that matter, SLO burn-rate alerting instead of per-server thresholds, and automated escalation into your rotation. Your team keeps first response; we build and maintain the signal.

Tier 2 — Escalation Tier
The usual shape. Your team or your tooling catches it first and we take the escalation, owning diagnosis and remediation for systems and servers with versioned runbooks and a documented severity path.

Tier 3 — First Tier with AI Triage
We take first response, with AI triage filtering alert noise before a human is paged -- so the page that reaches someone is the one worth waking up for. Response targets agreed in the SOW and reported monthly.

How We Onboard
Instrument, tune to real load, then pick the tier that fits.
Tooling & Instrumentation
Two weeks: deploy Datadog (or wire into your existing APM), instrument services with OpenTelemetry, integrate PagerDuty, and document the top 20 runbooks. Output: a tool stack, SLO definitions, and an on-call rotation schedule.
Baseline & SLO Definition
Days 15-45: define SLOs per customer-facing service (four golden signals each), set burn-rate alert thresholds, and validate against 30 days of historical data so the alerts tune to real load patterns rather than synthetic guesses.
Steady-State Operations
Coverage at the agreed tier, with AI triage tuned as alert patterns emerge. Monthly reports against the targets in your SOW, quarterly game-day exercises with your engineering team, and runbook updates whenever architecture changes ship.
Tooling & Instrumentation
Two weeks: deploy Datadog (or wire into your existing APM), instrument services with OpenTelemetry, integrate PagerDuty, and document the top 20 runbooks. Output: a tool stack, SLO definitions, and an on-call rotation schedule.
Baseline & SLO Definition
Days 15-45: define SLOs per customer-facing service (four golden signals each), set burn-rate alert thresholds, and validate against 30 days of historical data so the alerts tune to real load patterns rather than synthetic guesses.
Steady-State Operations
Coverage at the agreed tier, with AI triage tuned as alert patterns emerge. Monthly reports against the targets in your SOW, quarterly game-day exercises with your engineering team, and runbook updates whenever architecture changes ship.
Reactive vs. Proactive Support
Why proactive monitoring matters.
| Feature | Reactive | Proactive |
|---|---|---|
| Alerting Posture | Per-server CPU/memory thresholds, frequent false positives | SLO burn-rate alerts on customer-facing signals, tuned to real load |
| Sev-1 Response | Pages whoever is around, runbook lookup happens during the incident | Routed rotation with versioned runbooks and AI triage, against a target we agreed with you |
Alerting Posture
Sev-1 Response

IT Infrastructure Management Checklist
Our checklist covering observability, SLOs, and SRE practice for growing companies.
Read the whitepaperMonitoring & Incident Response FAQs
Common questions about coverage tiers, escalation, and triage.
Related Services
Buyers of monitoring & incident response typically partner with us across these adjacent disciplines
IT Infrastructure Management
Monitoring and SRE coverage are the same discipline — the runbooks that catch incidents come from the team that designed the architecture.
Disaster Recovery & Business Continuity
When monitoring detects a region-level event, DR runbooks are what bring the business back online. The two practices share runbook discipline and on-call rotation.
Cloud Cost Management
Observability data feeds right-sizing decisions — same Datadog signals that prevent incidents also surface idle and over-provisioned workloads.
Need Reliable IT Support?
Book a free monitoring assessment.